Plug Into More Green Stock News
Tap into the pulse of emerging green sectors every morning. Top daily headlines from clean energy, cleantech, cannabis, and sustainable transport stocks:
Cansortium Reports Second Quarter 2022 Financial Results
- Q2 Revenue up 14% QoQ and 36% YoY to a Record $22.4 Million
- Q2 Adjusted EBITDA up 64% QoQ and 95% YoY to a Record $10.2 Million, with $4.3 Million of
Cash from Operations - Reaffirms 2022 Guidance of $90-$95 Million of Revenue and $25-$28 Million of
Adjusted EBITDA
Cansortium Inc. (CSE:TIUM.U) (OTCQX: CNTMF) ("Cansortium" or the "Company"), a vertically-integrated cannabis company operating under the Fluent™ brand, today announced financial and operating results for the second quarter ended June 30, 2022. Unless otherwise indicated, all results are presented in U.S. dollars.
"We generated a record quarter of results in Q2, highlighted by double-digit revenue growth, margin expansion and a material increase in adjusted EBITDA and cash flow generation," said CEO Robert Beasley. "The investments we have made to add scale and improve cultivation in Florida are paying dividends. Our Sweetwater indoor cultivation facility is now fully operational and the yields in our Tampa facility have doubled from the start of 2022, all of which has led to dramatically improved productivity at the store level and a consistent increase in new patient count. In fact, revenue in Florida was up 16% from Q1 without adding a single new store during the quarter."
Beasley continued: "I am very proud of what our team has accomplished this year, however we still have significant room to grow. We remain on track to open 4-5 new stores in Florida by year-end, and the final phase of our cultivation expansion in Tampa is nearly complete. We expect product from this new space to hit shelves in the next couple of months, just in time for one of our strongest periods of the year in Florida as we enter the holidays."
Q2 2022 Financial Highlights (vs. Q2 2021)
- Revenue increased 36% to $22.4 million compared to $16.5 million.
- Florida revenue increased 33% to $18.8 million compared to $14.2 million.
- Adjusted gross profit1 increased 40% to $15.0 million or 67.0% of revenue, compared to $10.7 million or 65.1% of revenue.
- Adjusted EBITDA increased 95% to $10.2 million or 45.4% of revenue, compared to $5.2 million or 31.7% of revenue.
- Cash from operations increased significantly to $4.3 million compared to cash used of $(0.7) million.
- At June 30, 2022, the Company had approximately $8.9 million of cash and cash equivalents and $69.3 million of total debt, with approximately 252.3 million fully diluted shares outstanding (based on treasury stock method and share price on July 31, 2022).
Operational Highlights
- In Florida, the Company anticipates opening 4-5 new stores by the end of 2022. All of these locations are currently under contract and going through construction.
- In Pennsylvania, the Company opened its third dispensary in Annville in April.
- In August, the Company discontinued its operations in Michigan due to unfavorable market conditions. By ceasing operations in Michigan, Cansortium is expected to save approximately $0.5 million in operating expenses per year.
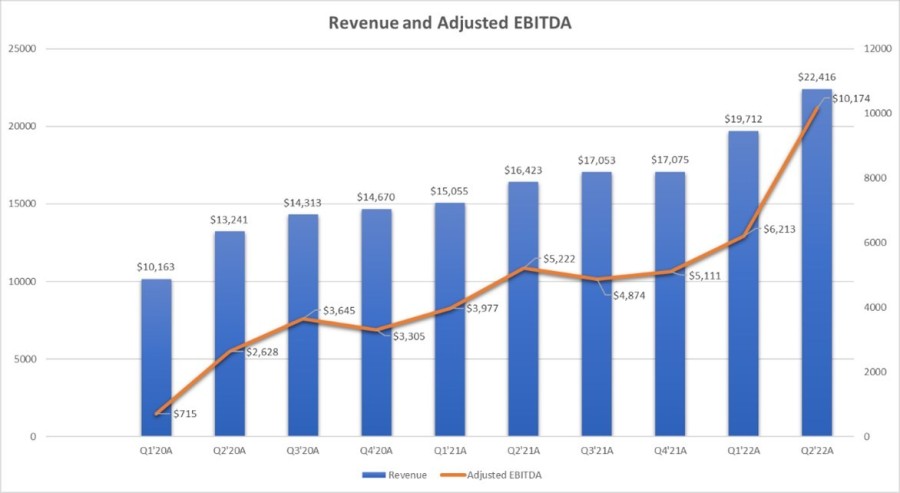
- As highlighted in the chart below, the Company has experienced ten consecutive quarters of revenue growth in addition to material improvements in adjusted EBITDA, reaching record levels for both metrics.
______________________________ |
1 Adjusted gross profit is a non-IFRS financial measure that does not have any standardized meaning prescribed by IFRS and may not be comparable to similar measures presented by other companies. The Company calculates adjusted gross profit from gross profit plus (minus) the changes in fair value of biological assets, as presented in the consolidated statement of operations. |
2022 Outlook
The Company continues to expect revenue in 2022 to range between $90-$95 million, reflecting an approximate 42% increase from 2021 at the midpoint. Cansortium also continues to expect adjusted EBITDA in 2022 to range between $25-$28 million, reflecting an approximate 35% increase from 2021.
Conference Call
The Company will host a conference call and live audio webcast today at 4:30 p.m. Eastern time to discuss its financial and operational results, followed by a question-and-answer period.
Date: Monday, August 29, 2022
Time: 4:30 p.m. Eastern time
Toll-free dial-in number: (800) 319-4610
International dial-in number: (604) 638-5340
Conference ID: 10020139
Link: Cansortium Conference Call
Please call the conference telephone number 5-10 minutes prior to the start time. An operator will register your name and organization. If you have any difficulty connecting with the conference call, please contact Elevate IR at (720) 330-2829.
The conference call will also be available for replay via the News & Events section of the Company's investor relations website at https://investors.getfluent.com/.
About Cansortium Inc.
Cansortium is a vertically-integrated cannabis company with licenses and operations in Florida, Pennsylvania and Texas. The Company operates under the Fluent™ brand and is dedicated to being one of the highest quality cannabis companies for the communities it serves. This is driven by Cansortium's unrelenting commitment to operational excellence in cultivation, production, distribution and retail. The Company is headquartered in Miami, Florida.
Cansortium Inc.'s common shares trade on the CSE under the symbol "TIUM.U" and on the OTCQX Best Market under the symbol "CNTMF". For more information about the Company, please visit www.getfluent.com.
Forward-Looking Information
Certain information in this news release may constitute forward-looking information within the meaning of applicable Canadian securities legislation and may also contain statements that may constitute "forward-looking statements" within the meaning of the safe harbor provisions of the United States Private Securities Litigation Reform Act of 1995. In some cases, but not necessarily in all cases, forward-looking information can be identified by the use of forward-looking terminology such as "plans", "targets", "expects" or "does not expect", "is expected", "an opportunity exists", "is positioned", "estimates", "intends", "assumes", "anticipates" or "does not anticipate" or "believes", or variations of such words and phrases or state that certain actions, events or results "may", "could", "would", "might", "will" or "will be taken", "occur" or "be achieved". In addition, any statements that refer to expectations, projections, or other characterizations of future events or circumstances contain forward-looking information. Statements containing forward-looking information are not historical facts but instead represent the Company's expectations, estimates, and projections regarding future events, plans or objectives, many of which, by their nature, are inherently uncertain and outside of the Company's control.
Forward-looking information is necessarily based on many opinions, assumptions, and estimates that, while considered reasonable by the Company as of the date of this news release, are subject to known and unknown risks, uncertainties, assumptions, and other factors that may cause the actual results, level of activity, performance or achievements to be materially different from those expressed or implied by such forward-looking information, including but not limited to the factors described in the public documents of the Company available at www.sedar.com. These factors are not intended to represent a complete list of the factors that could affect the Company; however, these factors should be considered carefully. There can be no assurance that such estimates and assumptions will prove to be correct. The forward-looking statements contained in this news release are made as of the date of this news release, and the Company expressly disclaims any obligation to update or alter statements containing any forward-looking information, or the factors or assumptions underlying them, whether as a result of new information, future events or otherwise, except as required by law.
For further information: www.getfluent.com.
Company Contact
Robert Beasley, CEO
(850) 972-8077
investors.getfluent.com
Investor Relations Contact
Sean Mansouri, CFA
Elevate IR
(720) 330-2829
This email address is being protected from spambots. You need JavaScript enabled to view it.
CANSORTIUM INC. | ||||||
CONSOLIDATED STATEMENTS OF FINANCIAL POSITION | ||||||
As of June 30, 2022 and December 31, 2021 | ||||||
(USD '000) | ||||||
June 30, | December 31, | |||||
Assets | ||||||
Current assets | ||||||
Cash and cash equivalents | $ 8,858 | $ 9,024 | ||||
Trade receivable | 59 | 26 | ||||
Inventory, net | 12,209 | 8,981 | ||||
Biological assets | 4,118 | 3,297 | ||||
Investment held for sale | 200 | 200 | ||||
Prepaid expenses and other current assets | 1,178 | 2,007 | ||||
Total current assets | 26,622 | 23,535 | ||||
Property and equipment, net | 33,846 | 34,160 | ||||
Intangible assets, net | 95,057 | 95,822 | ||||
Right-of-use assets, net | 19,480 | 19,169 | ||||
Note receivable | - | 4,886 | ||||
Deposit | - | 2,727 | ||||
Goodwill | 1,526 | 1,526 | ||||
Other assets | 628 | 632 | ||||
Total assets | $ 177,158 | $ 182,457 | ||||
Liabilities | ||||||
Current liabilities | ||||||
Trade payable | 8,889 | 8,518 | ||||
Accrued liabilities | 7,723 | 5,846 | ||||
Income taxes payable | 7,747 | 2,120 | ||||
Derivative liabilities | 8,669 | 3,960 | ||||
Current portion of notes payable | 634 | 619 | ||||
Current portion of lease obligations | 2,657 | 2,500 | ||||
Total current liabilities | 36,319 | 23,563 | ||||
- | ||||||
Notes payable | 55,459 | 53,674 | ||||
Lease obligations | 21,573 | 21,091 | ||||
Deferred tax liability | 21,259 | 21,563 | ||||
Total liabilities | 134,610 | 119,891 | ||||
Shareholders' equity | ||||||
Share capital | 180,792 | 180,657 | ||||
Share-based compensation reserve | 6,276 | 6,176 | ||||
Equity conversion feature | 6,677 | 4,933 | ||||
Warrants | 28,939 | 28,869 | ||||
Accumulated deficit | (179,802) | (157,649) | ||||
Foreign currency translation reserve | (334) | (421) | ||||
Total shareholders' equity | 42,548 | 62,565 | ||||
Total liabilities and shareholders' equity | $ 177,158 | $ 182,457 | ||||
CANSORTIUM INC. | ||||||||||
STATEMENT OF OPERATIONS | ||||||||||
FOR THE SIX MONTHS ENDED JUNE 30, 2021 AND 2020 | ||||||||||
For the three months ended | For the six months ended | |||||||||
2022 | 2021 | 2022 | 2021 | |||||||
Revenue, net of discounts | $ 22,416 | $ 16,469 | $ 42,128 | $ 31,584 | ||||||
Cost of goods sold | 7,405 | 5,745 | 15,571 | 11,152 | ||||||
Gross profit before fair value adjustments | 15,011 | 10,724 | 26,557 | 20,432 | ||||||
Fair value adjustments on inventory sold | (8,594) | (4,727) | (15,418) | (9,320) | ||||||
Unrealized gain on changes in fair value of biological assets | 9,467 | (1,224) | 10,666 | 5,655 | ||||||
Gross profit | 15,884 | 4,773 | 21,805 | 16,767 | ||||||
Expenses | ||||||||||
General and administrative | 2,319 | 2,868 | 5,160 | 6,156 | ||||||
Share-based compensation | - | 285 | 100 | 3,517 | ||||||
Sales and marketing | 4,190 | 3,515 | 8,277 | 7,061 | ||||||
Depreciation and amortization | 1,694 | 1,547 | 3,358 | 3,078 | ||||||
Total expenses | 8,203 | 8,215 | 16,895 | 19,812 | ||||||
(Loss) income from operations | 7,681 | (3,442) | 4,910 | (3,045) | ||||||
Other expense (income) | ||||||||||
Finance costs, net | 3,843 | 4,719 | 7,500 | 7,849 | ||||||
Loss (gain) on change in fair value of derivative liability | 3,007 | (1,143) | 4,709 | (1,551) | ||||||
Equity loss on investment in associate | - | - | - | - | ||||||
Private Placement issuance expense | - | 6,640 | - | 6,640 | ||||||
Loss on debt settlement | 1,136 | 10,751 | 1,136 | 10,751 | ||||||
Loss on disposal of assets | - | 1 | - | 50 | ||||||
Other (income) expense | (373) | (18) | (373) | (131) | ||||||
Total other expense | 7,613 | 20,950 | 12,971 | 23,608 | ||||||
Loss before income taxes | 68 | (24,392) | (8,061) | (26,653) | ||||||
Income tax expense | 3,504 | 594 | 5,516 | 3,431 | ||||||
Net loss from continuing operations | (3,436) | (24,986) | (13,577) | (30,084) | ||||||
Net loss (income) from discontinued operations | 8,574 | 33 | 8,576 | 31 | ||||||
Net loss | $ (12,010) | $ (25,019) | $ (22,153) | $ (30,115) | ||||||
Other comprehensive gain that may be reclassified | ||||||||||
to profit or loss in subsequent years | ||||||||||
Exchange differences on translation of foreign operations | 62 | (16) | 87 | (11) | ||||||
Comprehensive loss | $ (11,948) | $ (25,035) | $ (22,066) | $ (30,126) | ||||||
Net loss per share | ||||||||||
Basic and diluted - continuing operations | $ (0.05) | $ (0.11) | $ (0.09) | $ (0.14) | ||||||
Weighted average number of shares | ||||||||||
Basic number of shares | 252,276,742 | 225,401,664 | 252,276,742 | 213,945,477 | ||||||
Diluted number of shares | 308,755,503 | 274,403,491 | 307,984,934 | 246,123,568 | ||||||
CANSORTIUM INC. | ||
STATEMENTS OF CASH FLOWS | ||
(USD '000) | ||
For the six months ended June 30, | ||
2022 | 2021 | |
Operating activities | ||
Net loss from continuing operations | $ (22,153) | $ (30,115) |
Adjustments to reconcile net loss to net cash provided by (used in) operating activities: | ||
Unrealized gain on changes in fair value of biological assets | (10,666) | (5,655) |
Realized gain on changes in fair value of biological assets | 15,418 | 9,320 |
Share-based compensation | 100 | 3,517 |
Depreciation and amortization | 6,072 | 4,675 |
Accretion and interest of convertible debentures | - | 2,242 |
Interest and debt issuance costs of term loan | 6,219 | - |
Interest income on notes receivable | (71) | - |
Loss on disposal of assets | - | 50 |
Loss on debt settlement | 1,136 | 10,751 |
Discontinued operations | 8,576 | 31 |
Change in fair market value of derivative | 4,709 | (1,551) |
Interest on lease liabilities | 1,310 | 1,239 |
Deferred tax expense | (304) | 959 |
Changes in operating assets and liabilities: | ||
Trade receivable | (33) | 26 |
Inventory | 1,044 | (554) |
Biological assets | (9,290) | (4,246) |
Prepaid expenses and other current assets | 117 | 1,875 |
Other assets | 5 | (61) |
Trade payable | 374 | (278) |
Accrued liabilities | 1,877 | (651) |
Income taxes payable | 5,627 | (10,523) |
Net cash provided by (used in) operating activities | 10,067 | (18,949) |
Investing activities | ||
Purchases of property and equipment | (4,214) | (8,408) |
Payment of notes receivable | 119 | 284 |
Proceeds from sale of property and equipment | - | 24 |
Advances for notes receivable | (94) | (1,020) |
Net cash used in investing activities | (4,189) | (9,120) |
Financing activities | ||
Proceeds from issuance of shares and warrants | - | 23,730 |
Proceeds from issuance of debt, net of loan issuance costs | - | 63,133 |
Proceeds from issuance of convertible debenture and warrants | 4,656 | - |
Payment of lease obligations | (2,521) | (2,154) |
Exercise of Options | 135 | - |
Exercise of warrants | - | 1,365 |
Principal repayments of notes payable | - | (35,382) |
Repayments of principal and interest of Senior Secure Term loan | (8,401) | - |
Net cash provided by (used in) financing activities | (6,131) | 50,692 |
Effect of foreign exchange on cash and cash equivalents | 87 | (11) |
Net increase (decrease) in cash and cash equivalents | (166) | 22,612 |
Cash and cash equivalents, beginning of period | 9,024 | 3,392 |
Cash and cash equivalents, end of period | $ 8,858 | $ 26,004 |
CANSORTIUM INC. | |||
ADJUSTED EBITDA RECONCILIATION | |||
(USD '000) | |||
Three months ended | |||
June | June | Variance | |
30, 2022 | 30, 2021 | ||
Net loss | $ (12,010) | $ (25,019) | $ 13,009 |
Finance costs, net | 3,843 | 4,719 | (876) |
Income taxes | 3,504 | 594 | 2,910 |
Depreciation and amortization | 3,366 | 2,429 | 937 |
EBITDA | $ (1,297) | $ (17,277) | $ 15,980 |
Three months ended | |||
June | June | Variance | |
EBITDA | $ (1,297) | $ (17,277) | $ 15,980 |
Change in fair value of biological assets | (873) | 5,951 | (6,824) |
Change in fair market value of derivative | 3,007 | (1,143) | 4,150 |
Loss on debt settlement | 1,136 | 10,751 | (9,615) |
Private placement issuance expense | - | 6,640 | (6,640) |
Share-based compensation | - | 285 | (285) |
Discontinued operations | 8,574 | 33 | 8,541 |
Loss on disposal of assets | - | 1 | (1) |
Other non-recurring expense/(income) | (373) | (18) | (355) |
Adjusted EBITDA | $ 10,174 | $ 5,223 | $ 4,951 |

Plug Into More Green Stock News
Tap into the pulse of emerging green sectors every morning. Top daily headlines from clean energy, cleantech, cannabis, and sustainable transport stocks:
More Green Stock News


More Green Stock News
| Last Trade: | US$0.05 |
| Daily Volume: | 44,160 |
| Market Cap: | US$30.640M |
December 31, 2025 November 28, 2025 November 19, 2025 November 18, 2025 November 11, 2025 | |