
Ballard Power Systems (NASDAQ: BLDP) (TSX: BLDP) today announced consolidated financial results for the first quarter ended March 31, 2022. All amounts are in U.S. dollars unless otherwise noted and have been prepared in accordance with International Financial Reporting Standards (IFRS).
"The converging macro drivers of energy security and climate crisis have irreversibly shifted global views on the need to accelerate our energy transition," said Mr. Randy MacEwen, President and CEO. "This is the context as Ballard continues to build a valuable business that will help to decarbonize medium- and heavy-duty motive applications, including certain bus, truck, rail and marine market segments. We continue to focus on our customer relationships and achieve platform wins where Ballard's leading fuel cell technology offers a future zero-emission value proposition based on range, payload, rapid refueling, and attractive total cost of ownership."
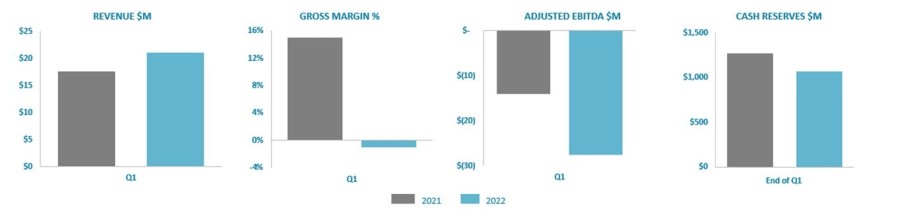
Mr. MacEwen remarked, "In the first quarter, we achieved revenue of $21.0 million, a 19% increase from Q1 2021, while also securing new orders totaling $27.8 million, driven primarily by European customers. Our gross margin compression is consistent with our 2022 plan, reflecting expected changes in our revenue mix, selling prices, and cost structure. On revenue mix, we have a heavier weighting of module product sales, including new modules in early volume production. On selling prices, we have been pricing certain low-volume customer pilot projects to secure platform wins with strategic accounts. On costs, fixed overhead costs are elevated as we invested in advanced manufacturing and production capacity expansion. Like others, we have also seen some inflationary cost pressures in our supply chain and freight. While we expect compressed gross margin in the near term, we are confident in margin expansion in the mid- to long-term driven by higher production volumes as customers transition from pilot projects to commercial deployment and as we continue to progress on our product cost reduction program."
"We ended the quarter with strong cash reserves of $1.1 billion, which enables us to execute our growth strategy. Our escalated investment is consistent with our outlook as we increase our spending on talent, technology, products, capabilities, and customer experience. We are confident investing ahead of the curve will position the company for significant market share as the adoption of hydrogen accelerates over the coming years," Mr. MacEwen added.
(all comparisons are to Q1 2021 unless otherwise noted)
Order Backlog ($M) | Order Backlog | Orders Received | Orders Delivered | Order Backlog |
Total Fuel Cell | $93.1 | $27.8 | $21.0 | $99.8 |
Ballard's 2022 outlook remains in line with previously stated 2022 guidance of Total Operating Expense4 between
$140 - $160 million and Capital Expenditure5 between $40 - $60 million.
(Millions of U.S. dollars, | Three months ended March 31, | ||
2022 | 2021 | % Change | |
REVENUE | |||
Fuel Cell Products & Services:1,2 | |||
Heavy Duty Motive | $6.9 | $6.9 | 0% |
Material Handling | $2.2 | $1.7 | 28% |
Stationary Power Generation | $4.1 | $0.8 | 447% |
Sub-Total | $13.3 | $9.4 | 41% |
Technology Solutions | $7.8 | $8.2 | (5)% |
Total Fuel Cell Products & Services Revenue | $21.0 | $17.6 | 19% |
PROFITABILITY Gross Margin $ | ($0.2) | $2.6 | (108)% |
Gross Margin % | (1)% | 15% | (16)-points |
Operating Expenses | $30.3 | $18.0 | 69% |
Cash Operating Costs3 | $26.1 | $14.3 | 82% |
Equity gain (loss) in JV & Associates | ($2.2) | ($3.0) | 27% |
Adjusted EBITDA3 | ($27.5) | ($14.0) | (97)% |
Net Income (Loss) from continuing operations | ($40.4) | ($17.8) | (127)% |
Earnings Per Share | ($0.14) | ($0.06) | (133)% |
CASH | |||
Cash provided by (used in) Operating Activities: | |||
Cash Operating Income (Loss) | ($24.6) | ($10.3) | (139)% |
Working Capital Changes | ($17.1) | ($5.4) | (217)% |
Cash provided by (used in) Operating Activities | ($41.7) | ($15.7) | (166)% |
Cash Reserves | $1,068.2 | $1,270.9 | (16)% |
For a more detailed discussion of Ballard Power Systems' first quarter 2022 results, please see the company's financial statements and management's discussion & analysis, which are available at www.ballard.com/investors, www.sedar.com and www.sec.gov/edgar.shtml.
Ballard will hold a conference call on Monday, May 9, 2022 at 8:00 a.m. Pacific Time (11:00 a.m. Eastern Time) to review first quarter 2022 operating results. The live call can be accessed by dialing +1.604.638.5340. Alternatively, a live audio and webcast can be accessed through a link on Ballard's homepage (www.ballard.com). Following the call, the audio webcast and presentation materials will be archived in the 'Earnings, Interviews & Presentations' area of the 'Investors' section of Ballard's website (www.ballard.com/investors).
Ballard Power Systems' (NASDAQ: BLDP; TSX: BLDP) vision is to deliver fuel cell power for a sustainable planet. Ballard zero-emission PEM fuel cells are enabling electrification of mobility, including buses, commercial trucks, trains, marine vessels, and stationary power. To learn more about Ballard, please visit www.ballard.com.
This release contains forward-looking statements concerning the hydrogen economy and markets for our products and the effects of governmental regulations on such markets, expected revenues, operating expenses, capital expenditures, corporate development activities, impacts of investments in manufacturing and R&D capabilities and market growth, and our carbon emissions goals. These forward-looking statements reflect Ballard's current expectations as contemplated under section 27A of the Securities Act of 1933, as amended, and Section 21E of the Securities Exchange Act of 1934, as amended. Any such statements are based on Ballard's assumptions relating to its financial forecasts and expectations regarding its product development efforts, manufacturing capacity, and market demand. For a detailed discussion of the factors and assumptions that these statements are based upon, and factors that could cause our actual results or outcomes to differ materially, please refer to Ballard's most recent management discussion & analysis. Other risks and uncertainties that may cause Ballard's actual results to be materially different include general economic and regulatory changes, detrimental reliance on third parties, successfully achieving our business plans and achieving and sustaining profitability. For a detailed discussion of these and other risk factors that could affect Ballard's future performance, please refer to Ballard's most recent Annual Information Form. These forward-looking statements are provided to enable external stakeholders to understand Ballard's expectations as at the date of this release and may not be appropriate for other purposes. Readers should not place undue reliance on these statements and Ballard assumes no obligation to update or release any revisions to them, other than as required under applicable legislation.
_________________________________
Endnotes
1 We report our results in the single operating segment of Fuel Cell Products and Services. Our Fuel Cell Products and Services segment consists of the sale and service of PEM fuel cell products for our power product markets of Heavy Duty Motive (consisting of bus, truck, rail and marine applications), Material Handling and Stationary Power Generation, as well as the delivery of Technology Solutions, including engineering services, technology transfer and the license and sale of our extensive intellectual property portfolio and fundamental knowledge for a variety of fuel cell applications.
2 The UAV market has been classified as a discontinued operation in our third quarter of 2020 consolidated condensed financial statements. As such, the assets of the UAV market have been classified as assets held for sale as of September 30, 2020. Furthermore, the historic operating results of the UAV market for 2020 have been removed from continuing operating results and are instead presented separately in the statement of comprehensive income as income from discontinued operations.
3 Note that Cash Operating Costs, EBITDA, and Adjusted EBITDA are non-GAAP measures. Non-GAAP measures do not have any standardized meaning prescribed by GAAP and therefore are unlikely to be comparable to similar measures presented by other companies. Ballard believes that Cash Operating Costs, EBITDA, and Adjusted EBITDA assist investors in assessing Ballard's operating performance. These measures should be used in addition to, and not as a substitute for, net income (loss), cash flows and other measures of financial performance and liquidity reported in accordance with GAAP. For a reconciliation of Cash Operating Costs, EBITDA, and Adjusted EBITDA to the Consolidated Financial Statements, please refer to the tables below.
Cash Operating Costs measures operating expenses excluding stock-based compensation expense, depreciation and amortization, impairment losses or recoveries on trade receivables, restructuring charges, acquisition related costs, the impact of unrealized gains or losses on foreign exchange contracts, and financing charges. EBITDA measures net loss from continuing operations excluding finance expense, income taxes, depreciation of property, plant and equipment, and amortization of intangible assets. Adjusted EBITDA adjusts EBITDA for stock-based compensation expense, transactional gains and losses, asset impairment charges, finance and other income, the impact of unrealized gains or losses on foreign exchange contracts, and acquisition related costs.
4 Total Operating Expenses refer to the measure reported in accordance with IFRS.
5 Capital Expenditure is defined as Additions to property, plant and equipment and Investment in other intangible assets as disclosed in the Consolidated Statements of Cash Flows
(Expressed in thousands of U.S. dollars) | Three months ended March 31, | |||
Cash Operating Costs | 2022 | 2021 | $ Change | |
Total Operating Expenses | $ 30,311 | $ 17,967 | $ 12,344 | |
Stock-based compensation expense | (2,329) | (2,338) | 9 | |
Impairment recovery (losses) on trade | - | - | - | |
Acquisition related costs | (118) | - | (118) | |
Restructuring (charges) recovery | (20) | (105) | 85 | |
Impact of unrealized gains (losses) on foreign | 347 | (118) | 465 | |
Depreciation and amortization | (2,102) | (1,087) | (1,015) | |
Cash Operating Costs | $ 26,089 | $ 14,319 | $ 11,770 | |
(Expressed in thousands of U.S. dollars) | Three months ended March 31 | ||||
EBITDA and Adjusted EBITDA | 2022 | 2021 | $ Change | ||
Net loss from continuing operations | $ (40,395) | $ (17,802) | $ (22,593) | ||
Depreciation and amortization | 3,109 | 1,869 | 1,240 | ||
Finance expense | 347 | 316 | 31 | ||
Income taxes (recovery) | (200) | 11 | (211) | ||
EBITDA | $ (37,139) | $ (15,606) | $ (21,533) | ||
Stock-based compensation expense | 2,329 | 2,338 | (9) | ||
Acquisition related costs | 118 | - | 118 | ||
Finance and other (income) loss | 7,491 | (822) | 8,313 | ||
Impairment loss on assets | - | - | - | ||
Impact of unrealized (gains) losses on foreign exchange contracts | (347) | $ 118 | (465) | ||
Adjusted EBITDA | $ (27,548) | $ (13,972) | $ (13,576) | ||


| Last Trade: | US$2.74 |
| Daily Change: | 0.005 0.18 |
| Daily Volume: | 448,497 |
| Market Cap: | US$822.520M |
November 13, 2025 September 17, 2025 August 11, 2025 June 05, 2025 | |